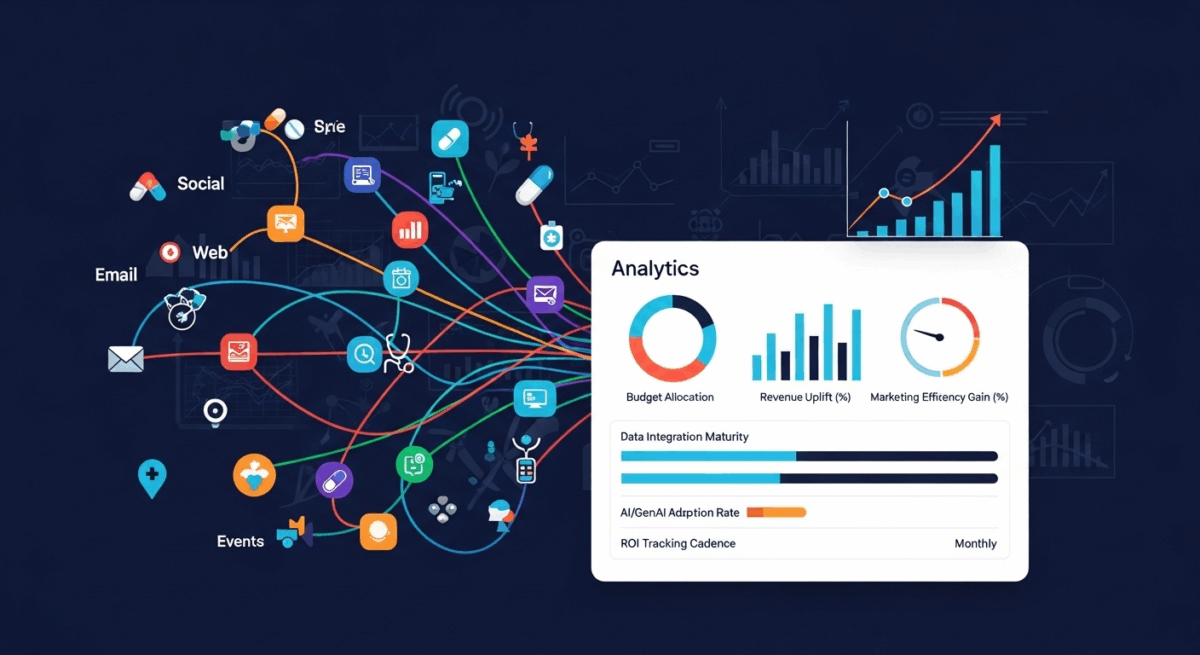
Omnichannel is non‑negotiable in pharma and medtech marketing. In recent study 97% of industry leaders say it’s vital. Yet execution remains consistently fragmented, and fewer than half even measure ROI regularly. That’s the mission-critical gap any marketer needs to bridge. I am here to help.
Benchmarks That Put ROI in Frame
1. Revenue Uplift
When omnichannel is done right, top performers record over 15% revenue gains.
Many report 5–15% lifts, particularly where personalised, multi-channel approaches are scaled.
2. Marketing Efficiency Gains
Pharma innovators using hybrid commercial models see 10–40% improvements in marketing efficiency—faster time to market and lower cost per outcome.
3. Investment Signals
Companies allocate 10–15% of their promotional and advertising budget to omnichannel solutions—evidence of meaningful investment.
4. Strategic Capability Gaps
As BCG study shows medtech and biopharma marketing leaders identifycritical gaps:
- 30% lack a clear omnichannel strategy, especially SMEs.
- 90% cite data silos as a major barrier; only 10% have fully integrated data systems.
- Only 7% are broadly leveraging AI/GenAI in omnichannel.
- Less than 17% review performance metrics more than monthly.
Pharma and MedTech Omnichannel Marketing KPI Template
Use this template as your go-to scorecard in dashboards or meetings. Tweak thresholds to match your maturity stage.
| Metric | Description / Use Case | Benchmark Range |
|---|---|---|
| Revenue Uplift (%) | Compare current period vs. baseline revenue | 5–15%, top performers >15% |
| Marketing Efficiency Gain (%) | Cost savings, time-to-market improvements | 10–40% |
| Revenue Growth Attribution (%) | Portion of growth tied directly to omnichannel efforts | ≥5% |
| Budget Allocation (%) | % of total ad/promo spend, dedicated to omnichannel | 10–15% |
| Data Integration Maturity | Internal scale (1–5) or Yes/No for integrated platforms | Full integration |
| AI/GenAI Adoption Rate | % workflows using AI-driven personalisation | ≥7% |
| ROI Tracking Cadence | Frequency of KPI reviews (daily, weekly, monthly) | Target: Monthly or finer |
| Next Best Experience Adherence Rate | % of next best-experience suggestions followed | Aim for >60% |
| HCP Satisfaction (NPS) | Net Promoter Score of omnichannel engagement | Top quartile |
How to Use This Template as a Tool for Change
- Start with the high-impact metrics revenue uplift, efficiency gain, budget share. Then layer in Omnichannel Marketing maturity and AI adoption.
- Set realistic benchmarks: for emerging teams aim at the 5–10% uplift band; for execution-capable teams push for 15%+.
- Track performance monthly those who review less frequently (only 17% do so monthly or more often) risk losing momentum.
- Address barriers consciously if AI or data integration scores are low, plan targeted investments or pilot programs.
- Use Next Best Experience adherence as a cultural pulse. Low compliance signals change management, not tech, is the bottleneck.
Final Take
Omnichannel in pharma and medtech is a strategic advantage—unless you fail to measure it. Now you have hard benchmarks and a KPI template proven in the field. Use them to bridge the gap between ambition and impact.
Metrics aren’t optional: they transform omnichannel from buzzword to business model.


